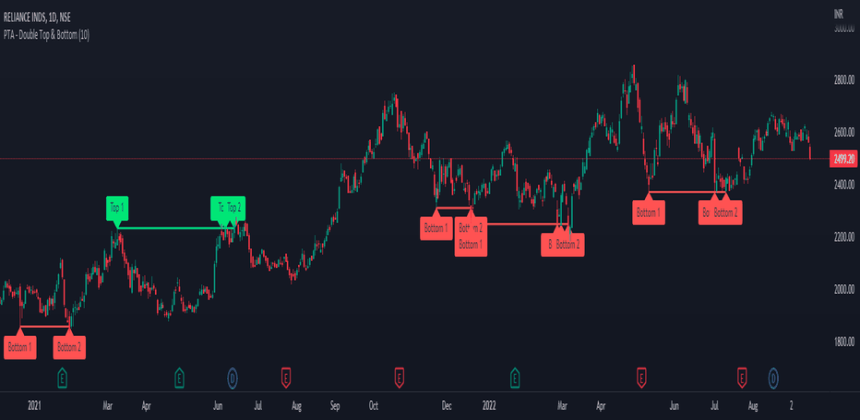
Chart patterns and indicators are essential tools used by traders to analyze price movements, identify trends, and make informed trading decisions in financial markets. Let's explore these concepts in more detail:
Chart Patterns:
Chart patterns are graphical representations of price movements over time, often forming recognizable shapes or patterns on price charts. These patterns can provide valuable insights into market sentiment and potential future price movements. Some common chart patterns include:
Trend Patterns:
- Uptrend: Characterized by higher highs and higher lows.
- Downtrend: Characterized by lower lows and lower highs.
- Sideways (or Range-bound) Trend: Characterized by horizontal price movements within a defined range.
Reversal Patterns:
- Head and Shoulders: A pattern consisting of three peaks, with the middle peak (head) higher than the other two (shoulders), indicating a potential trend reversal.
- Double Top/Bottom: A pattern where prices reach two consecutive peaks (double top) or troughs (double bottom), signaling a potential reversal in trend.
Continuation Patterns:
- Flag and Pennant: Consolidation patterns that occur after a strong price movement, often signaling a continuation of the existing trend.
- Symmetrical Triangle: A pattern characterized by converging trendlines, indicating indecision in the market before a potential breakout.
Chart patterns are subjective and require interpretation by traders. They are often used in conjunction with other technical analysis tools to confirm signals and enhance trading decisions.
Indicators:
Indicators are mathematical calculations applied to price and volume data to identify trends, momentum, volatility, and potential trading opportunities. There are various types of indicators, including:
Trend Indicators:
- Moving Averages: Smoothed averages of past price data used to identify trends and support/resistance levels.
- MACD (Moving Average Convergence Divergence): A trend-following momentum indicator that shows the relationship between two moving averages.
Momentum Indicators:
- Relative Strength Index (RSI): Measures the speed and change of price movements to indicate overbought or oversold conditions.
- Stochastic Oscillator: Identifies overbought and oversold conditions by comparing the current closing price to the price range over a specified period.
Volatility Indicators:
- Bollinger Bands: Measures volatility by plotting standard deviations around a moving average.
- Average True Range (ATR): Measures market volatility by calculating the average range between high and low prices over a specified period.
Traders use indicators to confirm trends, identify potential entry and exit points, and assess market conditions. It's essential to understand the strengths and limitations of each indicator and to use them in conjunction with other analysis techniques for more robust trading decisions.
